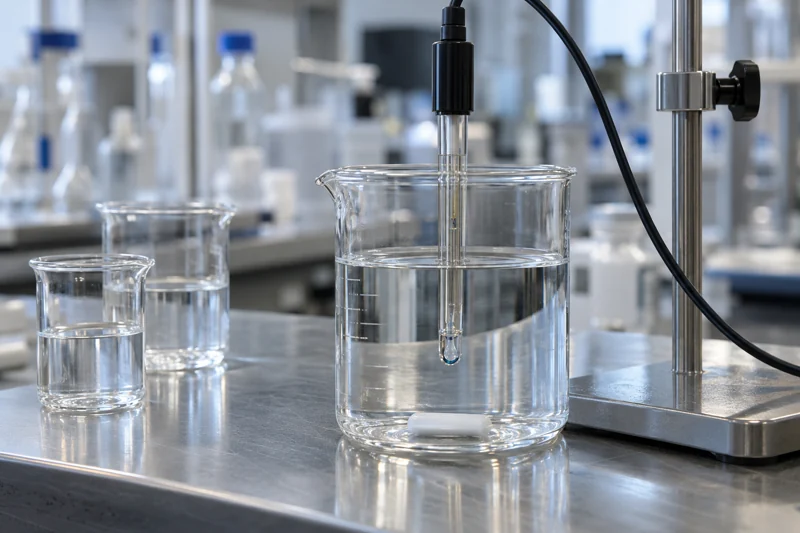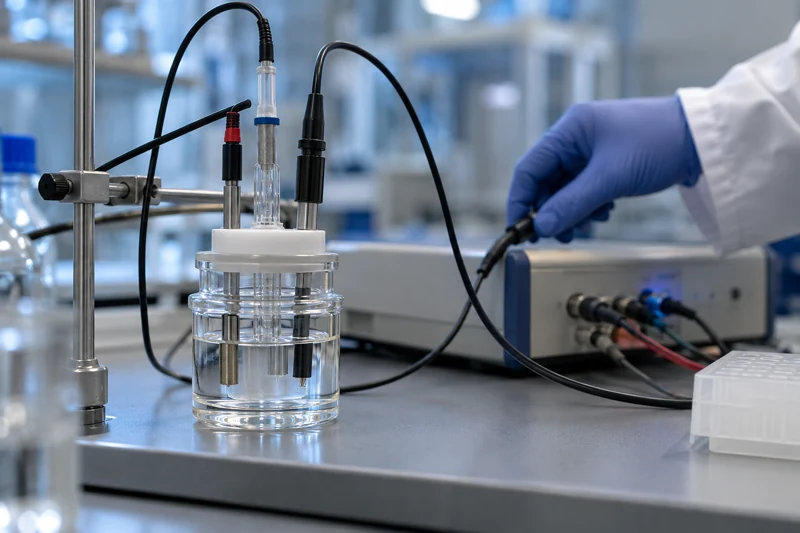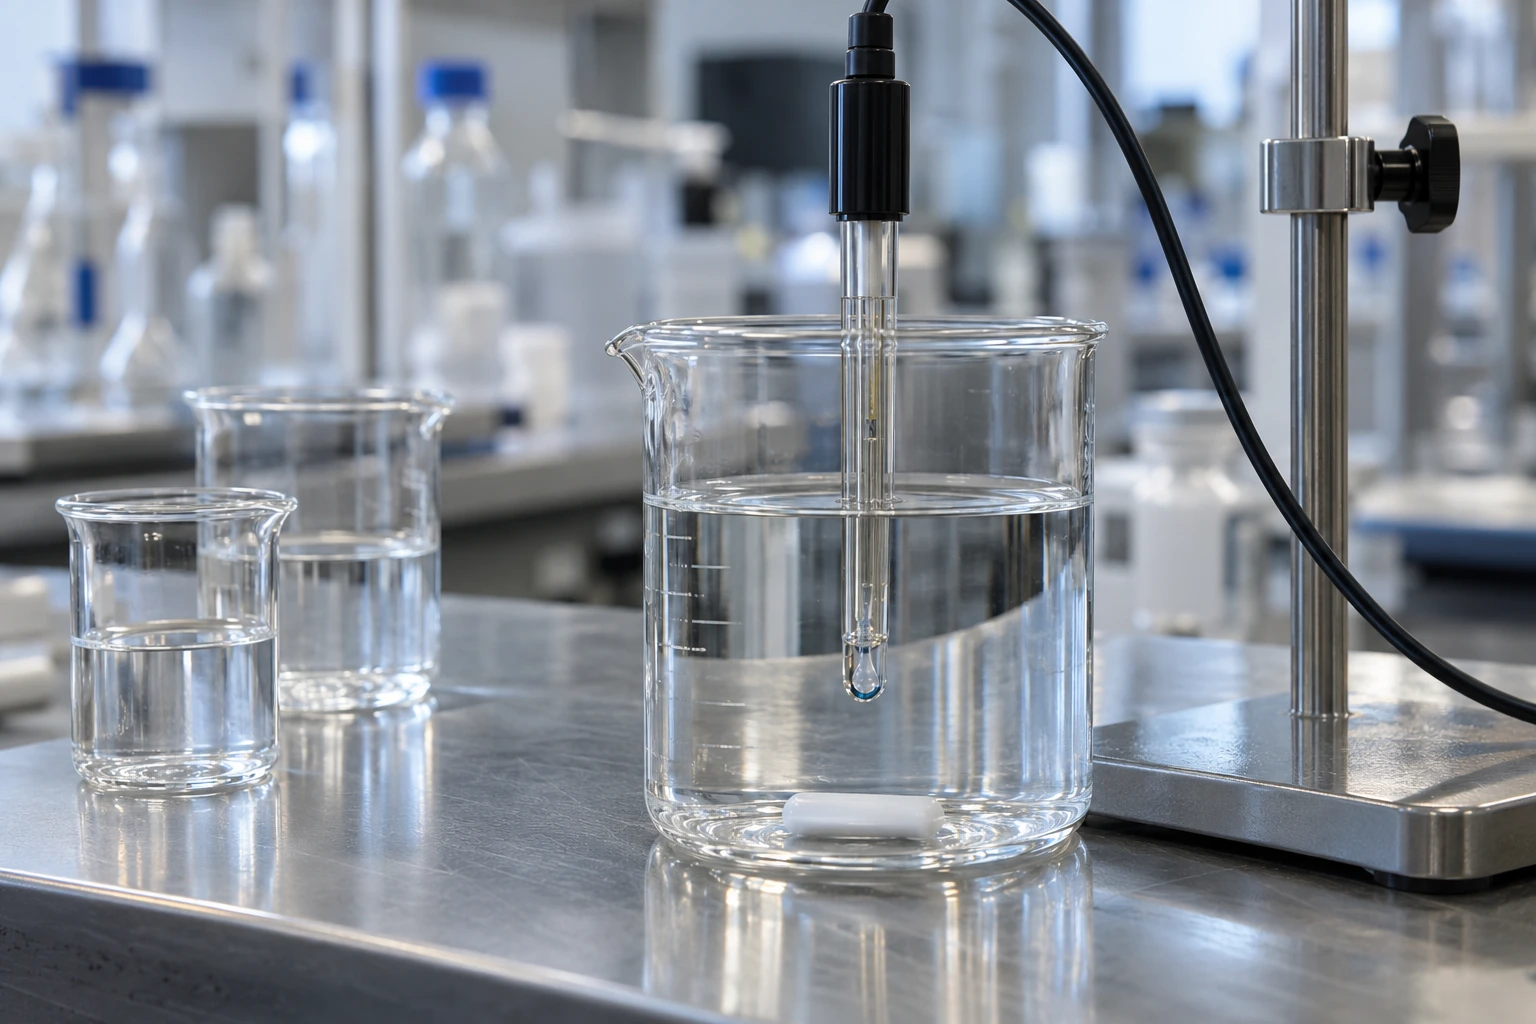
A gas in water is always entering and leaving
A glass of water exposed to air is not an empty container with a few oxygen molecules trapped inside. Gas molecules continually cross the air–water boundary in both directions. At equilibrium, the rates balance; the dissolved concentration is then the saturation concentration for that gas, liquid, temperature and pressure. A liquid can also sit above or below that equilibrium temporarily while exchange catches up.
Temperature matters because it changes that balance. For many gases dissolved in water, the equilibrium amount decreases as temperature rises. A cold glass can therefore release tiny air bubbles as it warms, even though no gas was added. The molecules were already dissolved; the warmer conditions make the gas phase more favorable. [1]
Henry’s law adds pressure to the picture
At a fixed temperature, Henry’s law gives a useful first model: dissolved concentration is proportional to the gas’s partial pressure above the liquid, C = kP. The constant k depends on the gas, solvent and temperature. Partial pressure matters because oxygen is only one component of air; the total atmospheric pressure is not all oxygen pressure. [1]
This relation is an equilibrium model, not a guarantee that a sample instantly reaches equilibrium. It is most useful for asking how the saturation target shifts when temperature or pressure changes while other conditions are held steady. The controlled oxygen-solubility measurements of Benson and Krause provide the underlying temperature and salinity dependence for fresh and seawater, across a stated laboratory range. [2]
A pressure change can halve the model prediction
Consider an imagined, well-mixed water sample at one fixed temperature. If the oxygen partial pressure above it were cut in half, Henry’s-law proportionality predicts half the equilibrium oxygen concentration, assuming the same dilute-solution behavior and no other change. This is a reasoning example, not a measured river result. It isolates pressure so that temperature, salinity and biological oxygen sources or sinks do not get silently folded into the calculation. [1]
The example also explains why elevation and weather pressure matter to a saturation calculation. At higher elevation, lower barometric pressure means a lower equilibrium oxygen concentration for otherwise comparable water. A concentration value in milligrams per litre, by itself, does not say whether the sample is close to saturation.
A soda bottle shows why temperature is not the only lever
An unopened carbonated drink combines both controls. It is sealed with a high carbon-dioxide pressure above the liquid, which supports a larger dissolved concentration. Opening the container drops that gas pressure; bubbles emerge as the liquid moves toward a new equilibrium. Warming also lowers gas solubility, so a warm opened drink generally loses carbonation faster. [1]
Carbon dioxide in a drink also reacts with water to form dissolved carbon-containing species, and a beverage is not pure water. Henry’s law remains a helpful frame for the gas–liquid exchange, but it is not a complete recipe for predicting taste, bubble size or the time until a drink seems flat. The analogy transfers the equilibrium idea, not every detail of beverage chemistry.
In lakes, saturation is a reference point, not a forecast
For oxygen in natural water, the equilibrium target depends on temperature, barometric pressure and dissolved salts. Warming lowers oxygen solubility; increasing salinity also lowers it. The primary Benson–Krause work measured the freshwater-to-seawater relationship and gives equations for equilibrium with air, while the USGS DOTABLES tool applies documented equations to user-specified temperature, pressure and salinity or conductivity. [2] [3]
That target helps compare water samples, but it does not predict the actual oxygen concentration on its own. A lake can be undersaturated if oxygen is being consumed faster than it enters, or supersaturated when photosynthesis and other inputs temporarily exceed losses. Currents and turbulence transport oxygen, while respiration, decomposition and chemical reactions remove it. [4]
A worked example separates concentration from saturation
Suppose an educational example reports 8 mg/L dissolved oxygen, while the calculated equilibrium saturation for that same temperature, pressure and salinity is 10 mg/L. The sample is at 80% saturation: 8 divided by 10, multiplied by 100. The arithmetic does not say why the water is below equilibrium. It only compares a measured concentration with a condition-specific reference.
If the water warms, the reference saturation changes even before any organism consumes oxygen. A comparison across two dates should therefore pair the measured concentration with temperature and the other inputs used for the saturation calculation. USGS DOTABLES explicitly computes both oxygen solubility and percent saturation from temperature, barometric pressure, salinity or specific conductance, and an optional measured oxygen value. [3]
What the calculation leaves outside its boundary
The USGS DOTABLES equations cover water temperatures from 0 to 40 °C, barometric pressures from 0.5 to 1.1 atmospheres, and salinity up to 40 parts per thousand. A result outside those stated ranges should not be treated as validated simply because a calculator returns a number. The tool documents the research and methods behind its equilibrium estimates, making the limits part of the result rather than fine print. [3]
In field interpretation, the next question is not just “How much oxygen can this water hold?” but “What processes are setting the oxygen we measured here and now?” Temperature changes the ceiling; light-driven production, respiration, decomposition and mixing shape the observed value. Keeping those two questions separate makes a gas-solubility rule useful without turning it into a one-variable explanation of an ecosystem. [4]
Gas solubility usually falls as water warms and rises with the gas’s partial pressure, but measured dissolved oxygen also depends on pressure, salinity, mixing, production and consumption.
Sources & further reading
Numbered references connect claims to their source. The main text is our original explanation; conceptual examples are identified as imagined.
- OpenStax — Chemistry 2e, 11.3: SolubilityOpen chemistry textbook · Henry’s law, temperature, pressure and gas solubility
- Benson & Krause — Oxygen dissolved in freshwater and seawater in equilibrium with the atmospherePrimary research paper · Limnology and Oceanography · 1984
- U.S. Geological Survey — DOTABLES: Dissolved oxygen solubility tablesUSGS calculation tool and methods documentation · oxygen saturation by temperature, pressure and salinity
- Senn, Downing-Kunz & Novick — Dissolved oxygen: Chapter 6USGS report · physical and biological controls on dissolved oxygen · 2016
Source review: 14 Nov 2026. Editorial standards.